%matplotlib inline
import matplotlib.pyplot as plt
import minkit
import numpy as np
from scipy.interpolate import make_interp_spline
m = minkit.Parameter('m', bounds=(10, 30))
c = minkit.Parameter('c', 20, bounds=(15, 25))
s = minkit.Parameter('s', 5, bounds=(3, 10))
g = minkit.Gaussian('g', m, c, s)
data = g.generate(200)
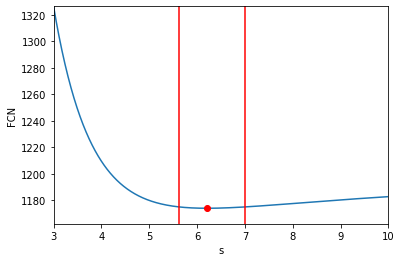
# Calculate the profile and the distance to the minimum
values = np.linspace(*s.bounds, 1000)
with minkit.minimizer('uml', g, data) as minimizer:
r = minimizer.minimize()
minimizer.minos('s') # minos must run before so the internal state of the minimum is set
smn = s.copy()
minimizer.minuit.print_level = 0 # reduce the verbosity of Minuit
profile = minimizer.minimization_profile('s', values)
minimizer.asymmetric_errors('s')
skt = s.copy()
# Split in left and right parts
distances = profile - r.fcn
cond = (values < s.value)
left_values = values[cond]
left_distances = distances[cond]
right_values = values[~cond]
right_distances = distances[~cond]
# Calculate the position where the FCN varies one unit
left_int = make_interp_spline(left_distances[::-1], left_values[::-1])
right_int = make_interp_spline(right_distances, right_values)
lv, rv = left_int(1), right_int(1)
# Plot the results
fmin, fmax = 0.99 * profile.min(), profile.max()
fig, ax = plt.subplots(1, 1, figsize=(6, 4))
ax.plot(values, profile);
ax.plot([s.value], [r.fcn], marker='o', color='red');
ax.plot((lv, lv), (fmin, fmax), 'r-', )
ax.plot((rv, rv), (fmin, fmax), 'r-', )
ax.set_xlabel('s');
ax.set_ylabel('FCN');
ax.set_xlim(*s.bounds)
ax.set_ylim(fmin, fmax);
# Show the result from the different methods
print(f'Value (profile): {s.value:.4f} + {rv - s.value:.4f} - {s.value - lv:.4f}')
print(f'Value (minkit): {skt.value:.4f} + {skt.asym_errors[1]:.4f} - {skt.asym_errors[0]:.4f}')
print(f'Value (minos): {smn.value:.4f} + {smn.asym_errors[1]:.4f} - {smn.asym_errors[0]:.4f}')