Functions and classes
Here you can find the documentation on the functions and classes of the hep_spt package.
Functions
|
Create an adaptive binned histogram in N dimensions. |
|
Create an adaptive binned histogram in one dimension. |
|
Create adaptive binned edges to make a histogram from the given data. |
|
Create a list of rectangles from a list of bins. |
Get a list with the names of the available styles. |
|
|
Get the length of the binary representation of the given value(s). |
|
Return the lower and upper frequentist uncertainties for a poisson distribution with mean “m”. |
|
Calculate poisson uncertainties based on the logarithm of likelihood. |
|
Calculate the centers of a set of bins given their edges. |
|
Return the frequentist Clopper-Pearson interval of having “k” events in “N”. |
|
Return the frequentist Clopper-Pearson uncertainties of having “k” events in “N”. |
|
Create an instance of CLsHypo given a probability density(mass) function, as an object of type |
|
Create an instance of |
|
Plot a correlation matrix in the given axes. |
|
Calculate the values needed to create an error bar histogram. |
|
Calculate the gaussian uncertainty for a given confidence level. |
|
Calculate the greatest common divisor of a set of numbers. |
|
Get the binary representation of the given value(s). |
|
Determine whether the input number(s) is a power of 2 or not. |
|
Compute the Kolmogorov-Smirnov statistic on 2 samples. |
|
Calculate the least common multiple of a set of numbers. |
|
Modify the matplotlib format in this context. |
|
Calculate the next number(s) greater than that(those) given and being a power(s) of 2. |
|
Get the optimal figure division for a given number of axes, where all the axes have the same dimensions. |
Retrieve the path to the directory containing the styles. |
|
|
Return the poisson frequentist uncertainty at one standard deviation of confidence level. |
|
Return the poisson uncertainty at one standard deviation of confidence level. |
|
Calculate the profile from a 2D data sample. |
|
Get the pull with the associated errors for a given set of values and a reference. |
|
Calculate the residual with its errors, for a set of values with respect to a reference. |
|
Create a random sample from the given rv_frozen object. |
|
Generate a |
|
Set the style for matplotlib to one within this project. |
|
Calculate mean and variance and standard deviations of the sample and the mean from the given array. |
|
Calculate the errors using the sum of squares of weights. |
|
Write text inside |
|
Calculate the symmetric Wald interval of having “k” elements in “N”. |
|
Calculate the symmetric Wald uncertainty of having “k” elements in “N”. |
|
Calculate the symmetric Wald interval for a weighted sample, where “k” is the array of weights in the survival sample and “N” in the main sample. |
|
Calculate the symmetric Wald uncertainty for a weighted sample, where “k” is the array of weights in the survival sample and “N” in the main sample. |
|
Assign a weight to the values in an input array using a set of edges. |
|
Calculate the Wilson interval of having “k” elements in “N”. |
|
Calculate the Wilson uncertainties of having “k” elements in “N”. |
Classes
|
Represent a n-dimensional adaptive bin. |
|
Represent an hypothesis to be used in the CLs method. |
|
Represent an hypothesis which works on a continuous domain. |
|
Represent an hypothesis which works on a discrete domain. |
|
Base class to represent the test-statistics function to work with the CLs method. |
|
Base class to represent the test-statistics function to work with the CLs method using hypothesis working on a continuous domain. |
|
Base class to represent the test-statistics function to work with the CLs method using hypothesis working on a discrete domain. |
|
Build the class from a given set of values following a certain distribution (the use of weights is allowed), or x and y values of a PDF. |
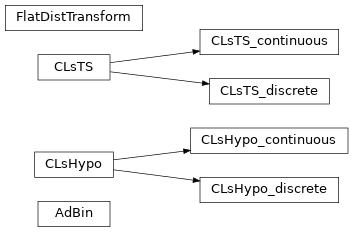
Class Inheritance Diagram